

Shifting Tastes, Rising Costs: Tracing India's New Expenditure Landscape
Shifting Tastes, Rising Costs: Tracing India's New Expenditure Landscape
India's spending shifts towards processed foods and higher healthcare and education costs, reflecting changing lifestyles and economic challenges

Introduction to Expenditure Trends Analysis
The Ministry of Statistics and Program Implementation release of the 2022-23 Household Consumption Expenditure Survey marks a critical point for economic analysis. This study juxtaposes the current expenditure figures against those of previous years, revealing evolving consumption patterns. By adjusting historical data to mirror current prices, a revealing narrative emerges about the spending behaviors in urban and rural India across a spectrum of categories. This article dissects these trends, offering insights into the changing dynamics of consumer expenditure.
Rural Expenditure Trends Over Time
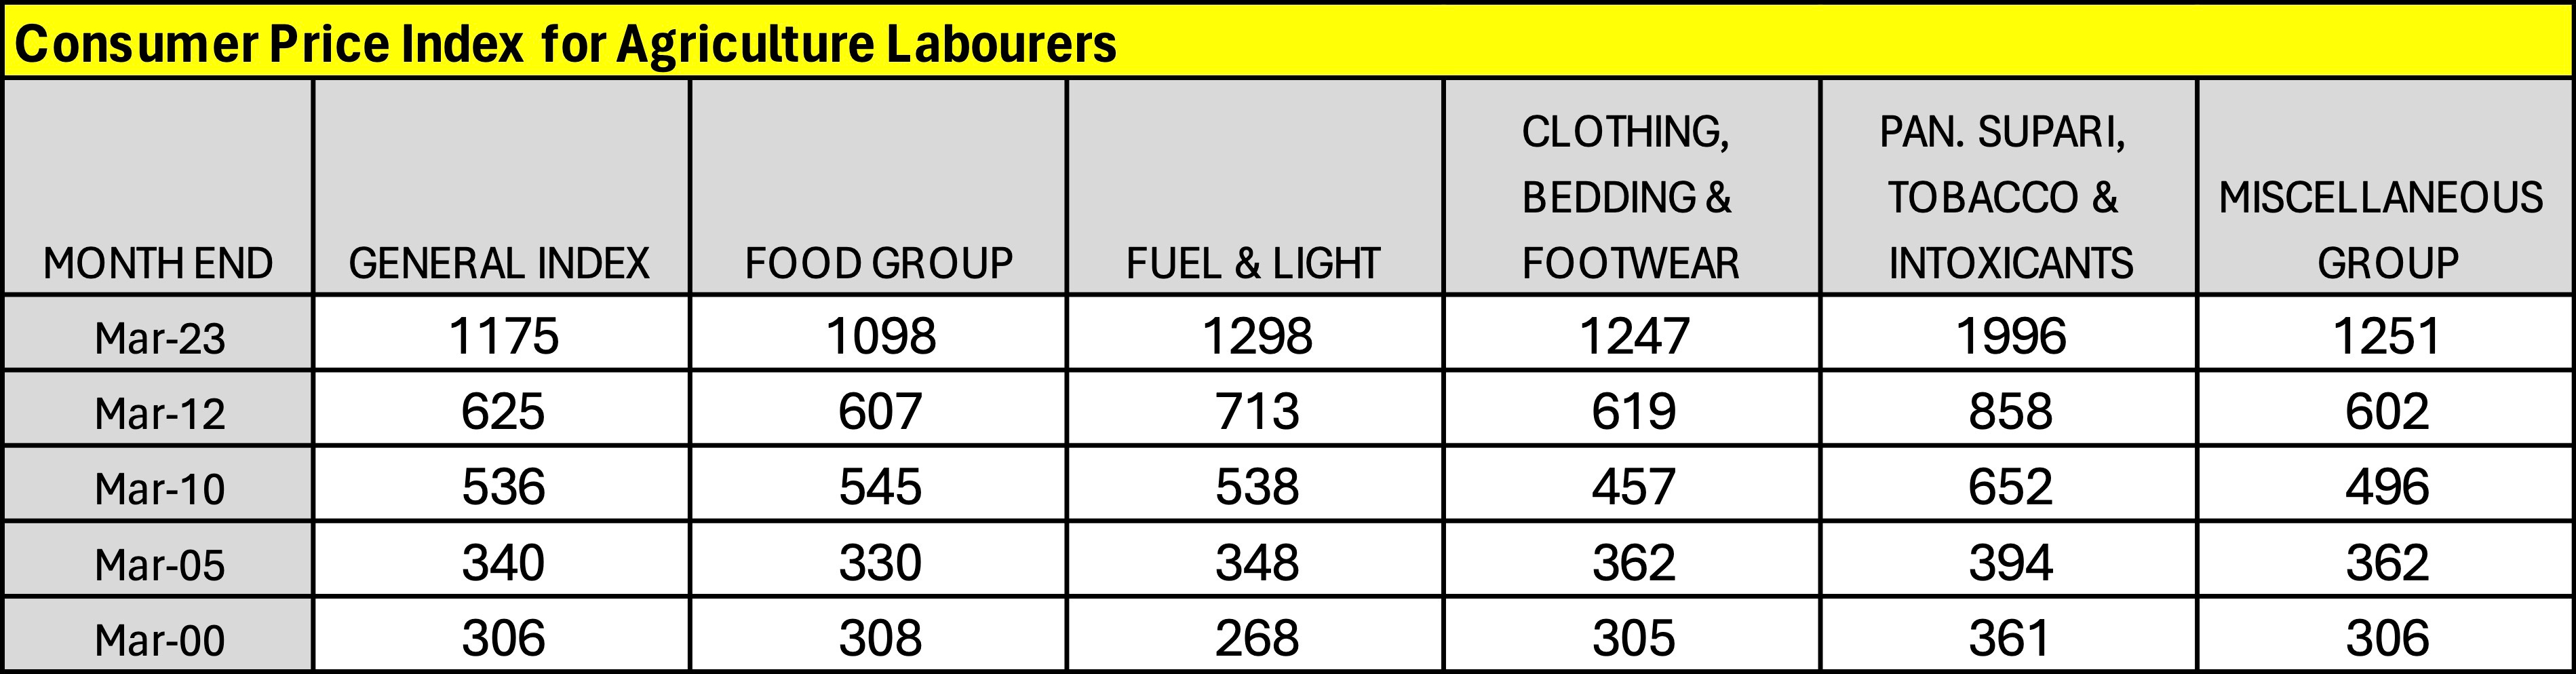
Adjusting Rural Expenditure Data with CPI
To reconcile the past with the present in rural expenditure data, we turn to the Consumer Price Index (CPI) for agricultural laborers from the Reserve Bank of India (RBI). This CPI recalibration offers a more accurate portrait of rural spending over time. A forthcoming chart will visualize these economic adjustments, while the subsequent table provides the CPI-adjusted rural expenditure data, denominated in Indian Rupees for clarity.
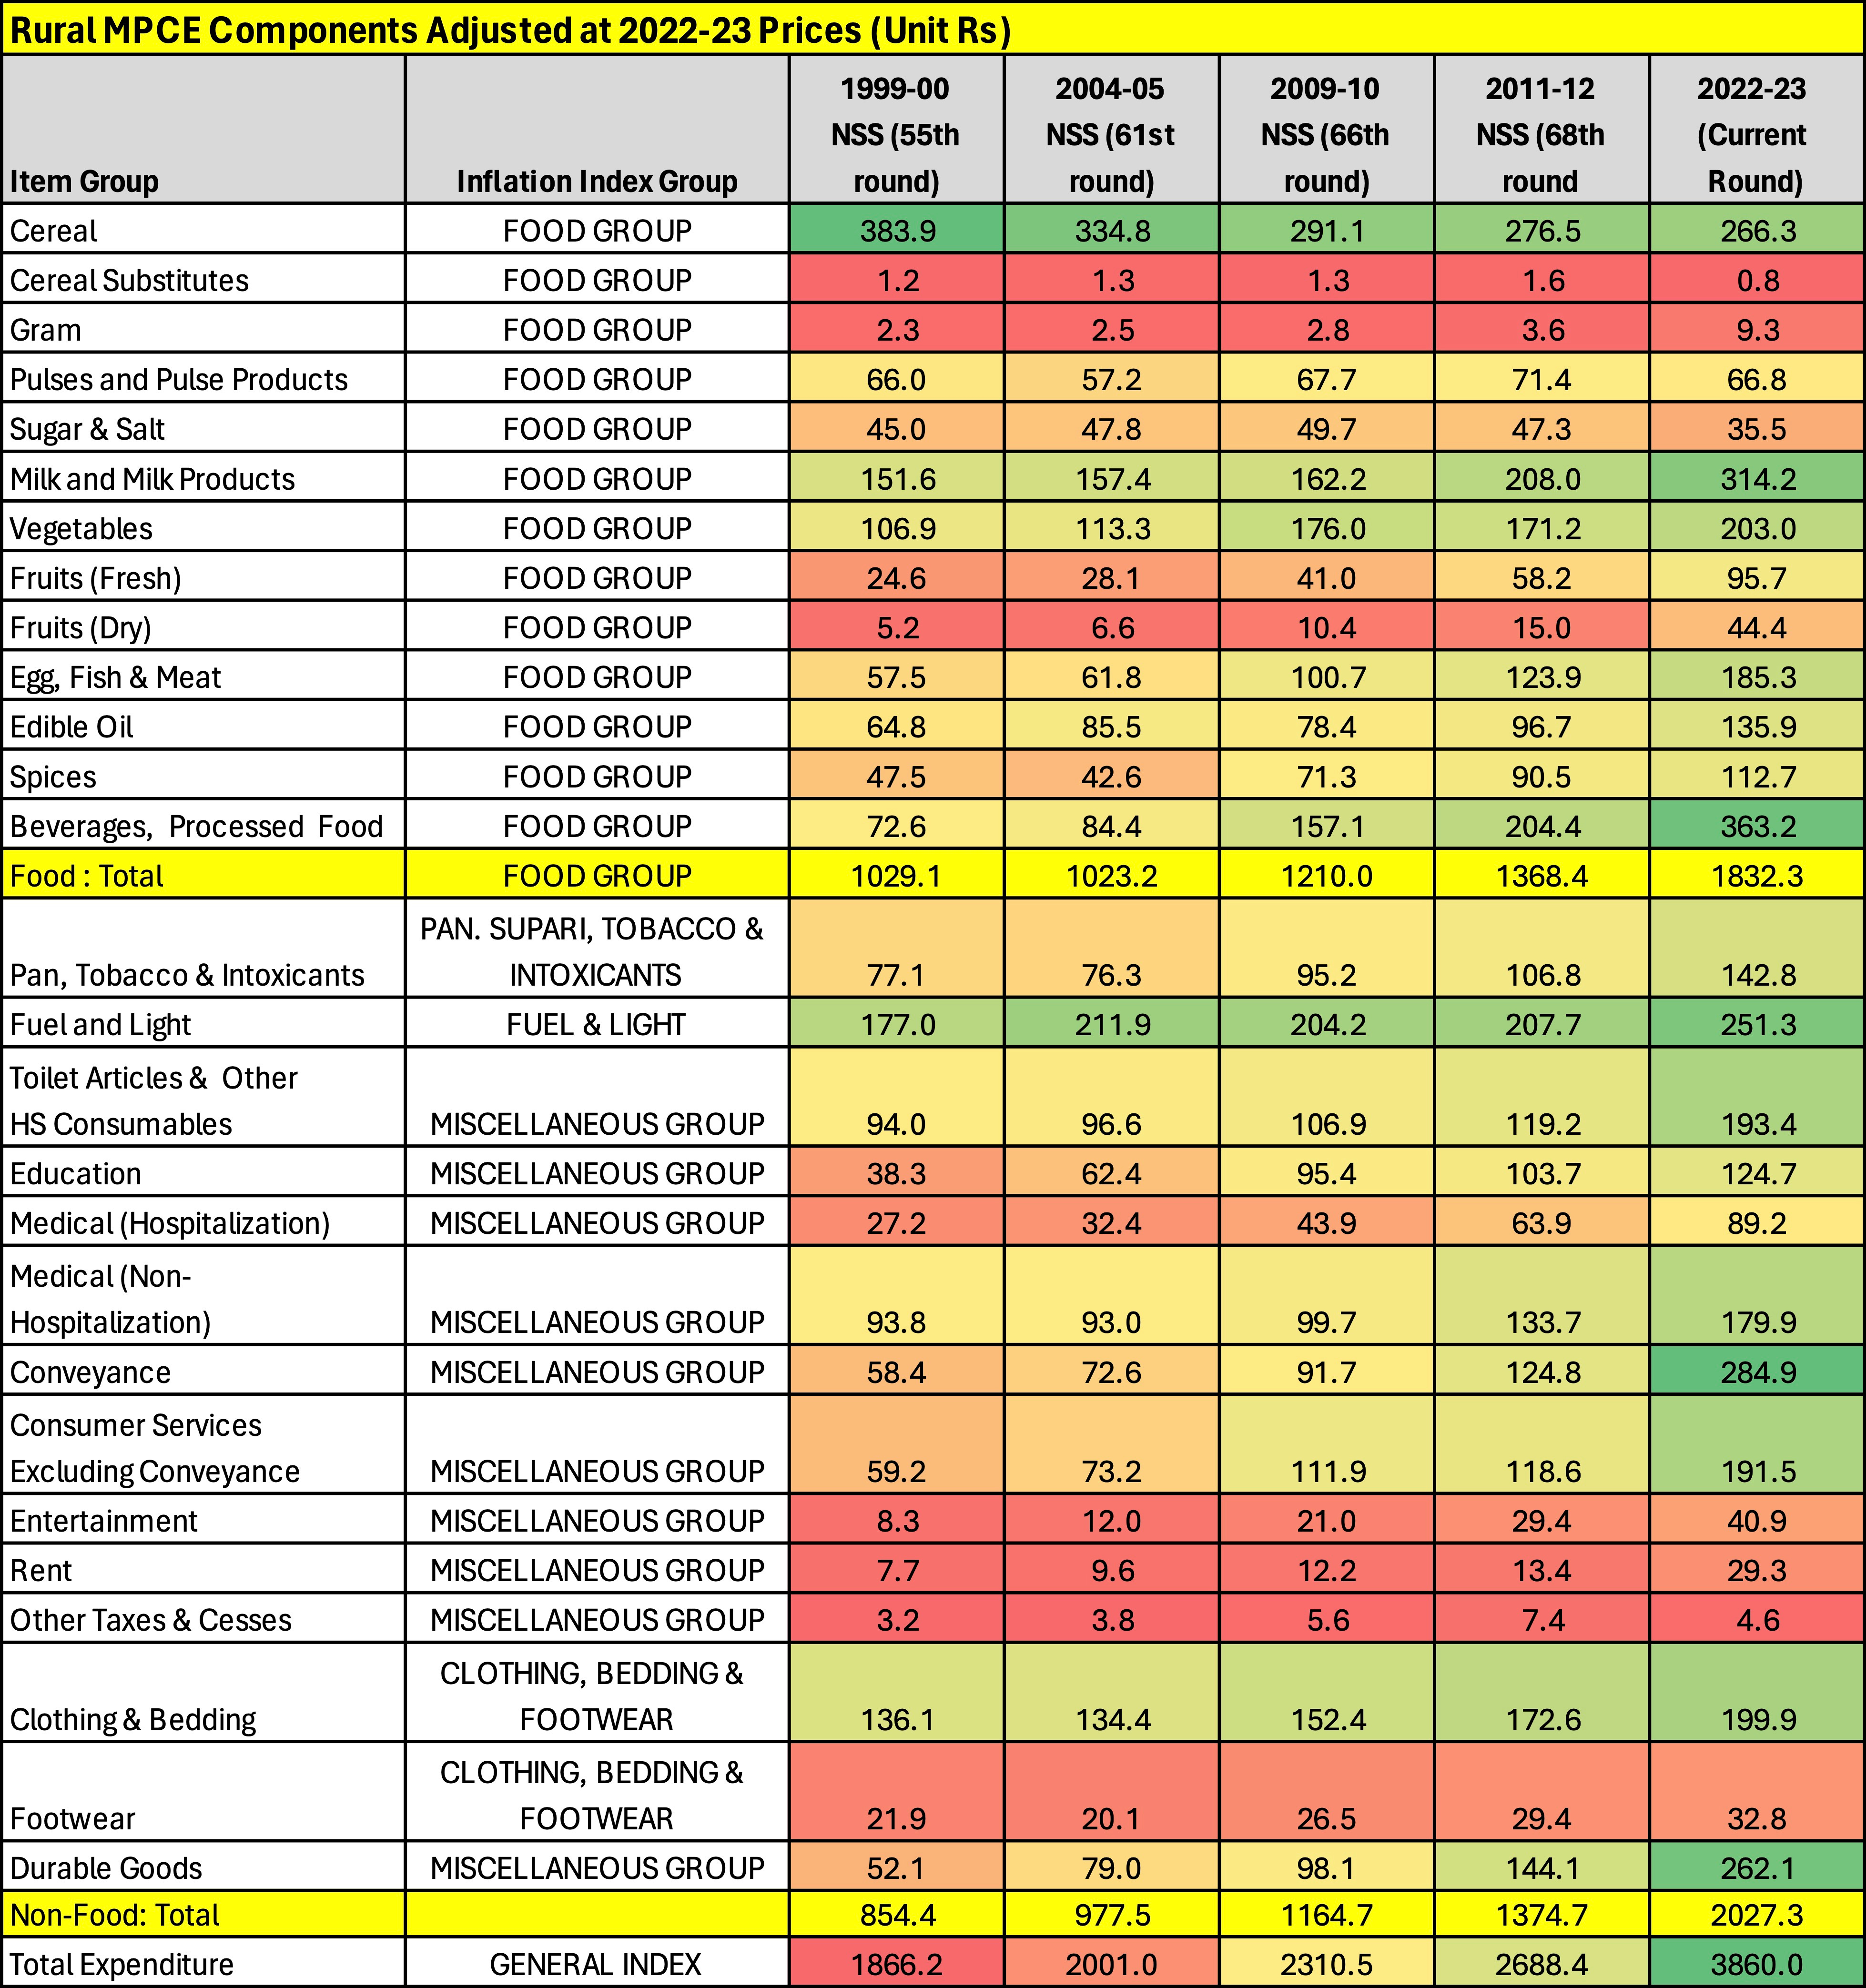
Mapping Rural MPCE Across Categories
The table below delineates the expenditure data across various periods, adjusted to the price levels of the current survey period using the aforementioned Consumer Price Index (CPI) data. This normalization process allows for an apples-to-apples comparison over time, providing insights into the evolution of spending behaviors. Each value in the table is denoted in Indian Rupees, ensuring a clear and consistent financial context. This adjusted data facilitates a comprehensive analysis of spending trends, aiding in the understanding of how expenditure patterns have shifted across different time frames.
Urban Expenditure Trajectories
In the analysis of urban monthly expenditure based on the survey data, I employed the Consumer Price Index (CPI) for Industrial Workers, as released by the Reserve Bank of India (RBI). However, a unique challenge was encountered due to the CPI for urban areas being segmented into multiple series over the period in question, unlike the continuous series available for the rural CPI.
To address this challenge and create a unified, consistent index, I employed a methodology where the index values of an earlier series were adjusted by multiplying them by the ratio of adjacent month indices from two consecutive series. This adjustment ensures a coherent and continuous index value stream across the entire timeline under review.
The table below presents the modified index values for industrial workers, offering a standardized metric to facilitate accurate and meaningful comparisons of urban expenditure over time. This methodological adjustment is critical for drawing reliable conclusions from the urban expenditure data.

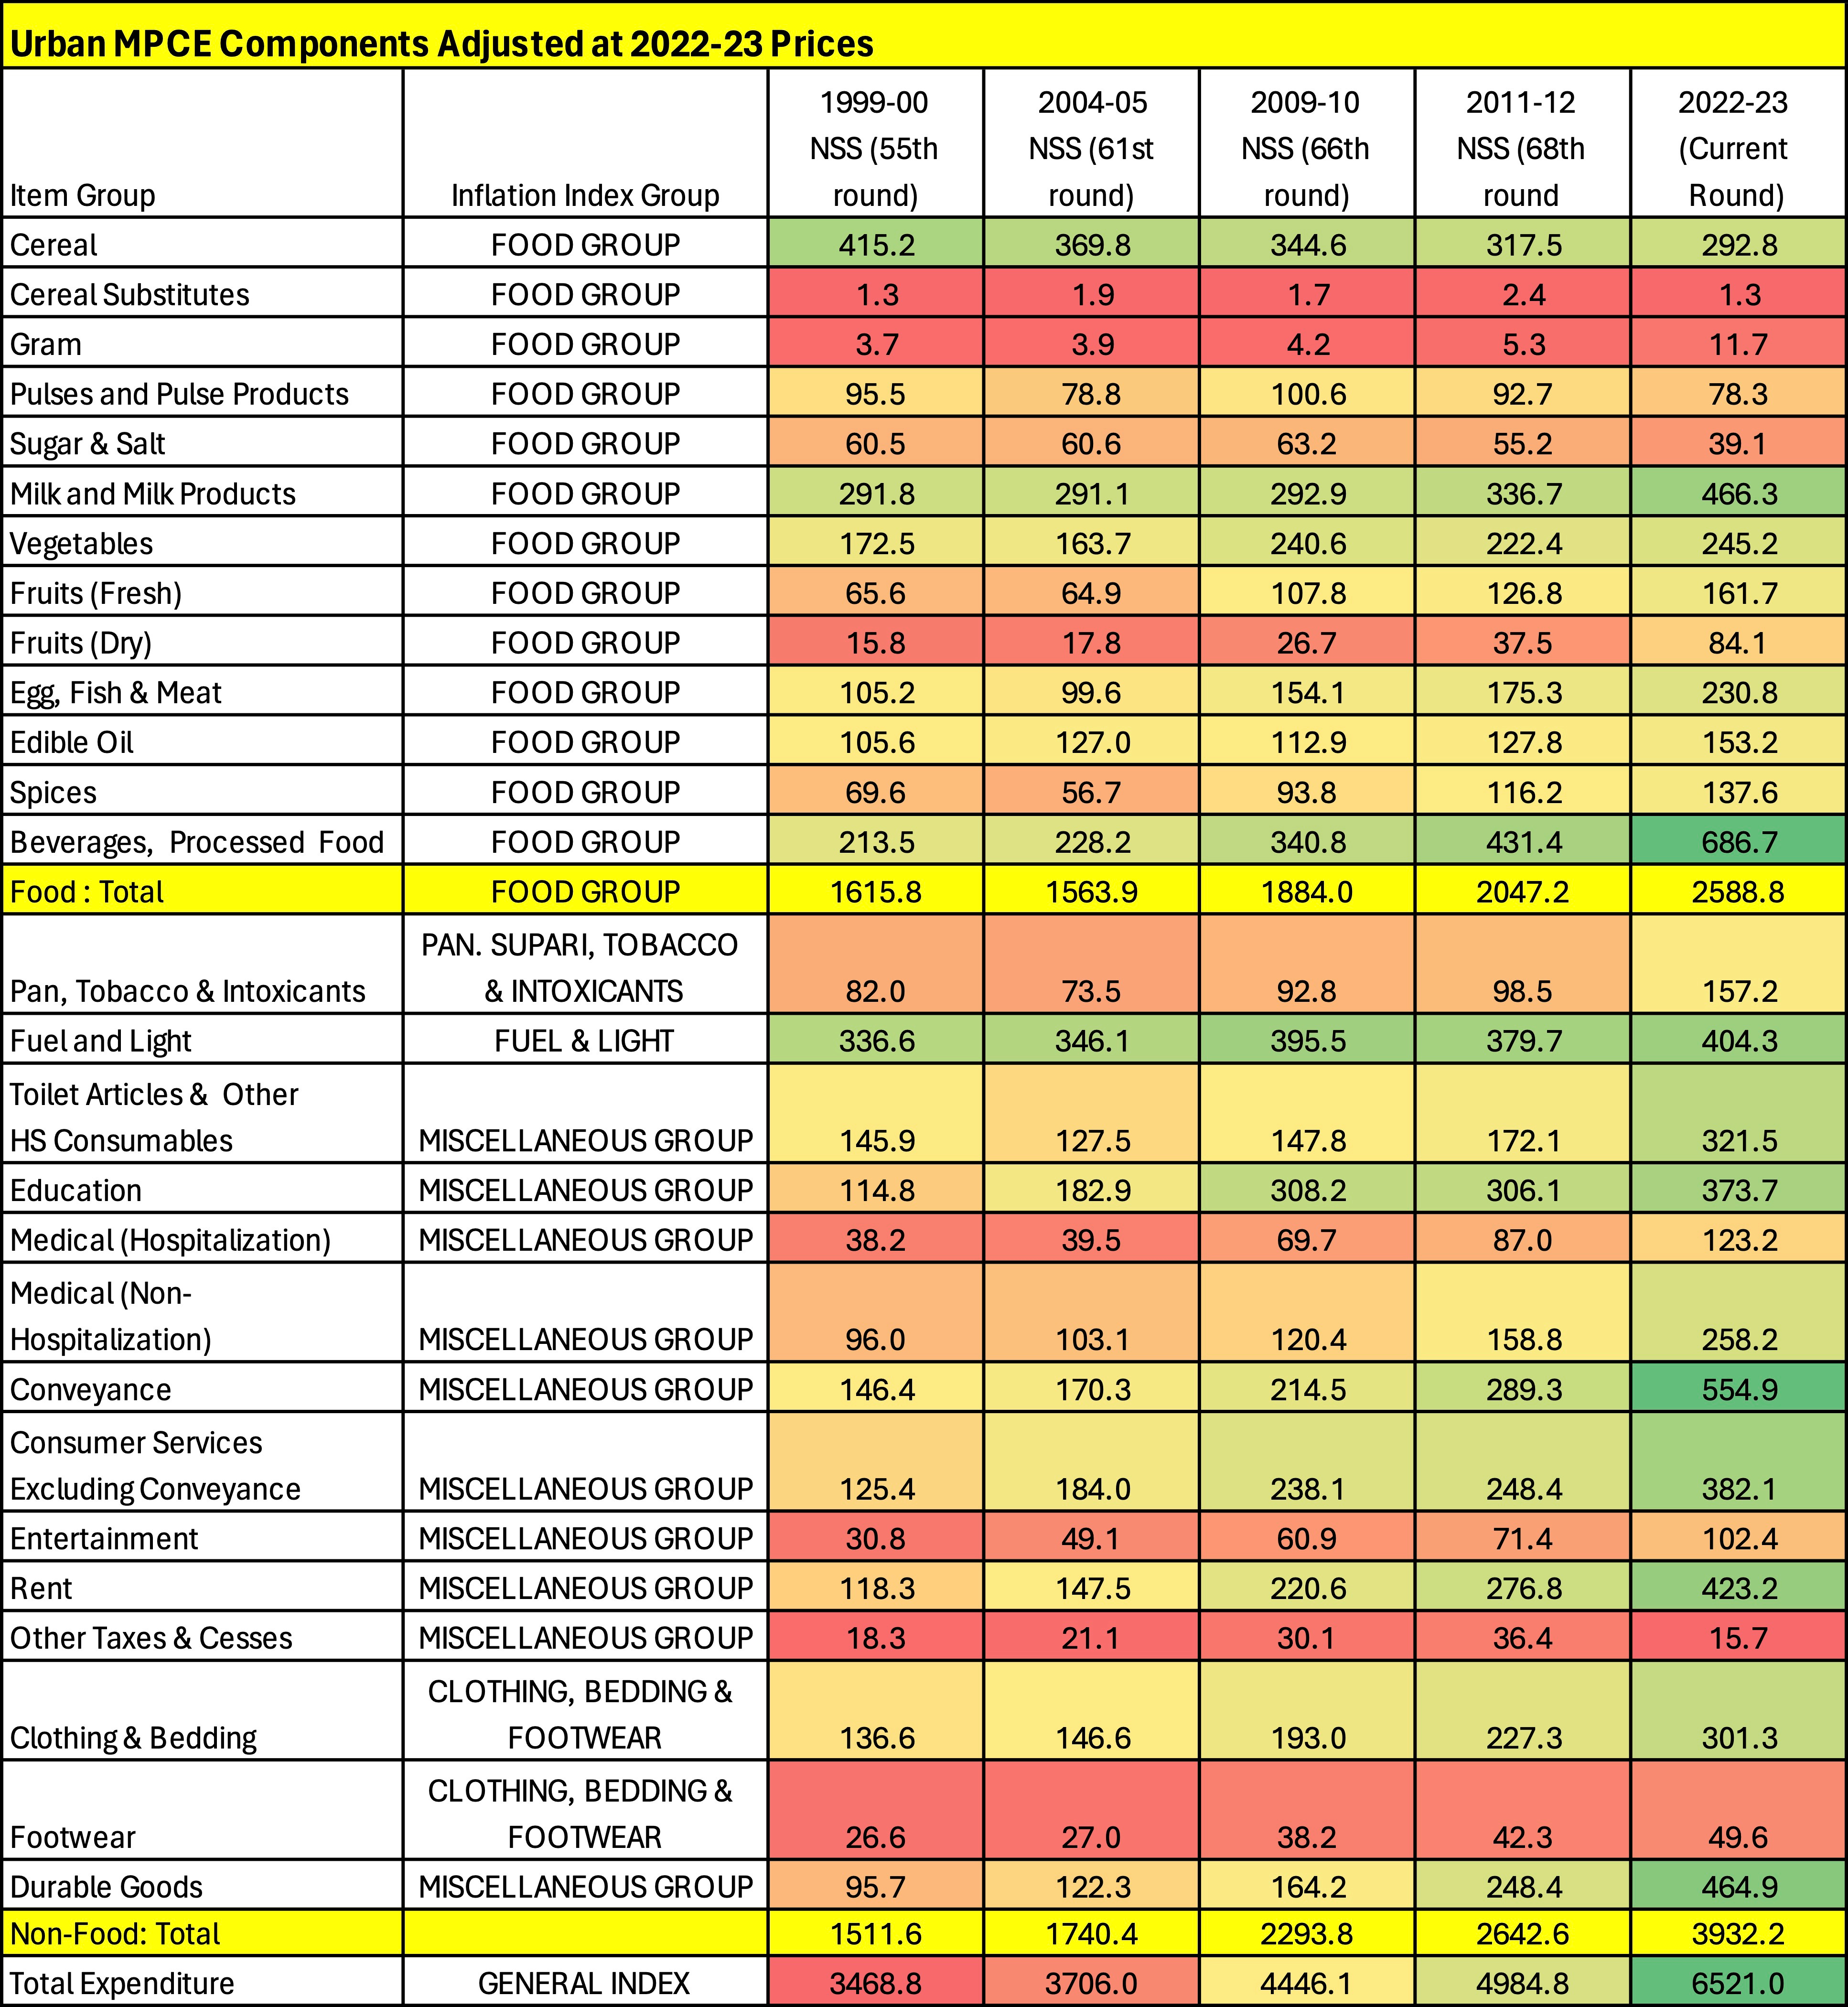
Mapping Urban MPCE Across Categories
Utilizing the adjusted Consumer Price Index (CPI) for Industrial Workers, I have methodically extracted the Urban MPCE components for various item groups, employing the same analytical strategy that was previously applied to the rural data. The extraction process involved standardizing expenditure data across different periods to reflect current price levels, enabling a consistent and comparative analysis.
The resulting data is presented in the table below, which enumerates the Urban MPCE across a range of item groups. This structured presentation not only facilitates an understanding of the spending patterns within urban settings but also allows for direct comparisons with rural expenditure trends, highlighting the distinct economic behaviors prevalent in each demographic.
Comparative Insights: Urban vs. Rural Expenditure Shifts
Highlighting Decades of Change
The comparative analysis of the Household Consumption Expenditure Survey results between 1999-2000 and 2022-23 reveals a discernible transformation in the spending habits of both urban and rural populations in India in multiples of the base year of 1999-2000. This is captured in the chart below.

Cereal consumption has significantly declined in both segments, with urban areas reporting a 29.5% decrease and rural areas close behind at 30.6%. Remarkably, there has been an exponential increase in the consumption of gram, with urban areas at 217.4% and rural at a striking 311.3%. While the intake of pulses remained relatively stable in rural areas, urban consumption dropped by 18%. In contrast, spending on milk and milk products surged by 59.8% in urban areas and an impressive 107.3% in rural areas, indicating a shift towards higher nutritional value food items.
Furthermore, there's been a pronounced increase in the consumption of fruits, both fresh and dry, with urban areas noting a 146.7% rise in fresh fruits and an astounding 432.4% in dry fruits, while rural areas have seen increases of 289.1% and 754.0%, respectively. Similarly, expenditures on eggs, fish, and meat more than doubled in rural areas and increased by 119.4% in urban locales. Beyond food, there were substantial increases in spending on education, medical care, and conveyance in both urban and rural settings, often exceeding 200%. Additionally, there was a significant uptick in urban expenditures on durable goods, with a 385.6% increase, and in rural areas, a similar growth pattern at 403.5%.
Overall, urban total expenditure grew by 88.0%, while rural areas experienced a more pronounced increase of 106.8%, underscoring broader economic developments and enhanced living standards. These findings illustrate not just changes in dietary habits but also a comprehensive evolution in the lifestyle and prioritization of services such as education, healthcare, and entertainment over the past two decades.
Conclusion
The data from the latest Household Consumption Expenditure Survey casts a revealing light on the dramatic shifts in Indian consumption patterns. Between 1999-2000 and 2022-23, we've witnessed a significant pivot in spending towards high-value fruits and processed foods. This rise underscores a dual narrative: on one hand, it signals a leap towards more varied and possibly more convenient dietary preferences; on the other, it raises questions about the departure from traditional, non-processed foods known for their health benefits. The surge in consumption of processed items suggests a transformation in lifestyle, potentially influenced by urbanization and the globalizing palate of the Indian consumer.
The pronounced increase in medical hospitalization expenses is another critical indicator, reflecting not just an enhanced access to and utilization of healthcare services, but also pointing to the escalating costs of hospital-based care. This trend may hint at a healthcare system increasingly reliant on high-cost interventions, perhaps at the expense of primary care which is typically more affordable.
Similarly, the swell in education-related spending speaks volumes. While it highlights the value placed on education, it also points to rising costs and possibly a weakening confidence in public schooling, driving the populace towards private institutions. This could indicate an education sector in flux, with government schools falling behind and subsidies not effectively bridging the gap, necessitating greater expenditure by households to ensure quality education.
In sum, these expenditure shifts are not mere numbers; they are indicators of deeper socioeconomic currents. As India strides into the future, these trends demand a nuanced policy response — one that promotes healthy consumption, ensures affordable healthcare, and delivers quality education to all segments of society. The insights from this expenditure survey are not just reflective of a changing India, but also prescriptive of the pathways the nation must carve to ensure sustainable and equitable growth.