

Fortifying Reserves: The Impact of Central Banks and Institutional Investors on the Gold Market
Fortifying Reserves: The Impact of Central Banks and Institutional Investors on the Gold Market
The future of gold demand is likely driven by Chinese central banks divesting from U.S. Treasuries and institutional investment amid global uncertainties.

Recently, the world has witnessed an unprecedented surge in the demand for gold. Central banks and other institutions globally are purchasing gold at record-high prices, reflecting a significant shift in the market. This note aims to present a coherent narrative through data, allowing readers to draw their own conclusions about the implications of these trends. Due to the scattered nature of the relevant data, this document has been meticulously compiled to aggregate essential information in one unified resource. Our goal is to provide a comprehensive overview that highlights the broader implications of the current gold price hike.
Gold Price Trends
The chart below displays the price trajectory of gold from calendar year 2010 (CY-10) through to the end of 2023 (CY-23). It is important to note that this chart does not reflect the most recent spike in gold prices during CY-23, where they soared to an all-time high of USD 2,300 per ounce. This recent escalation is beyond the scope of the displayed data.

The trend is clear: since calendar year 2015 (CY-15), gold prices have steadily risen, recovering from a decline where they fell from a high of USD 1,699 per ounce to USD 1,266 per ounce. Since that turning point in CY-15, the price of gold has increased by approximately 80% (Source - World Gold Council).
Gold Demand and Supply
To fully grasp the reasons behind the recent spike in demand and the corresponding surge in gold prices, it is crucial to examine the demand and supply dynamics of gold. I have compiled this data into a comprehensive dashboard, which is presented below for your review

From the chart provided, it is evident that the supply of gold hasn’t increased significantly over the years. A detailed comparison from calendar year 2016 (CY-16) to 2023 (CY-23) shows a modest overall growth of 2.3%. However, there were periods of decline, notably in CY-21 and CY-22.
On the demand side, the most substantial growth has been observed among central banks and other financial institutions (marked RED with dotted rectangle above), particularly from CY-22. In that year, demand surged to 2.4 times the levels of the previous calendar year, highlighting a significant shift in market dynamics.
Key Country-Wise Demand (Excluding Central Banks)
According to the World Gold Council, the country-specific demand for gold can be categorized into three primary segments: 1. Jewelry, 2. Consumer products, and 3. Bars and Coins. The demand trends for these categories across the top five countries have been illustrated in the charts below.
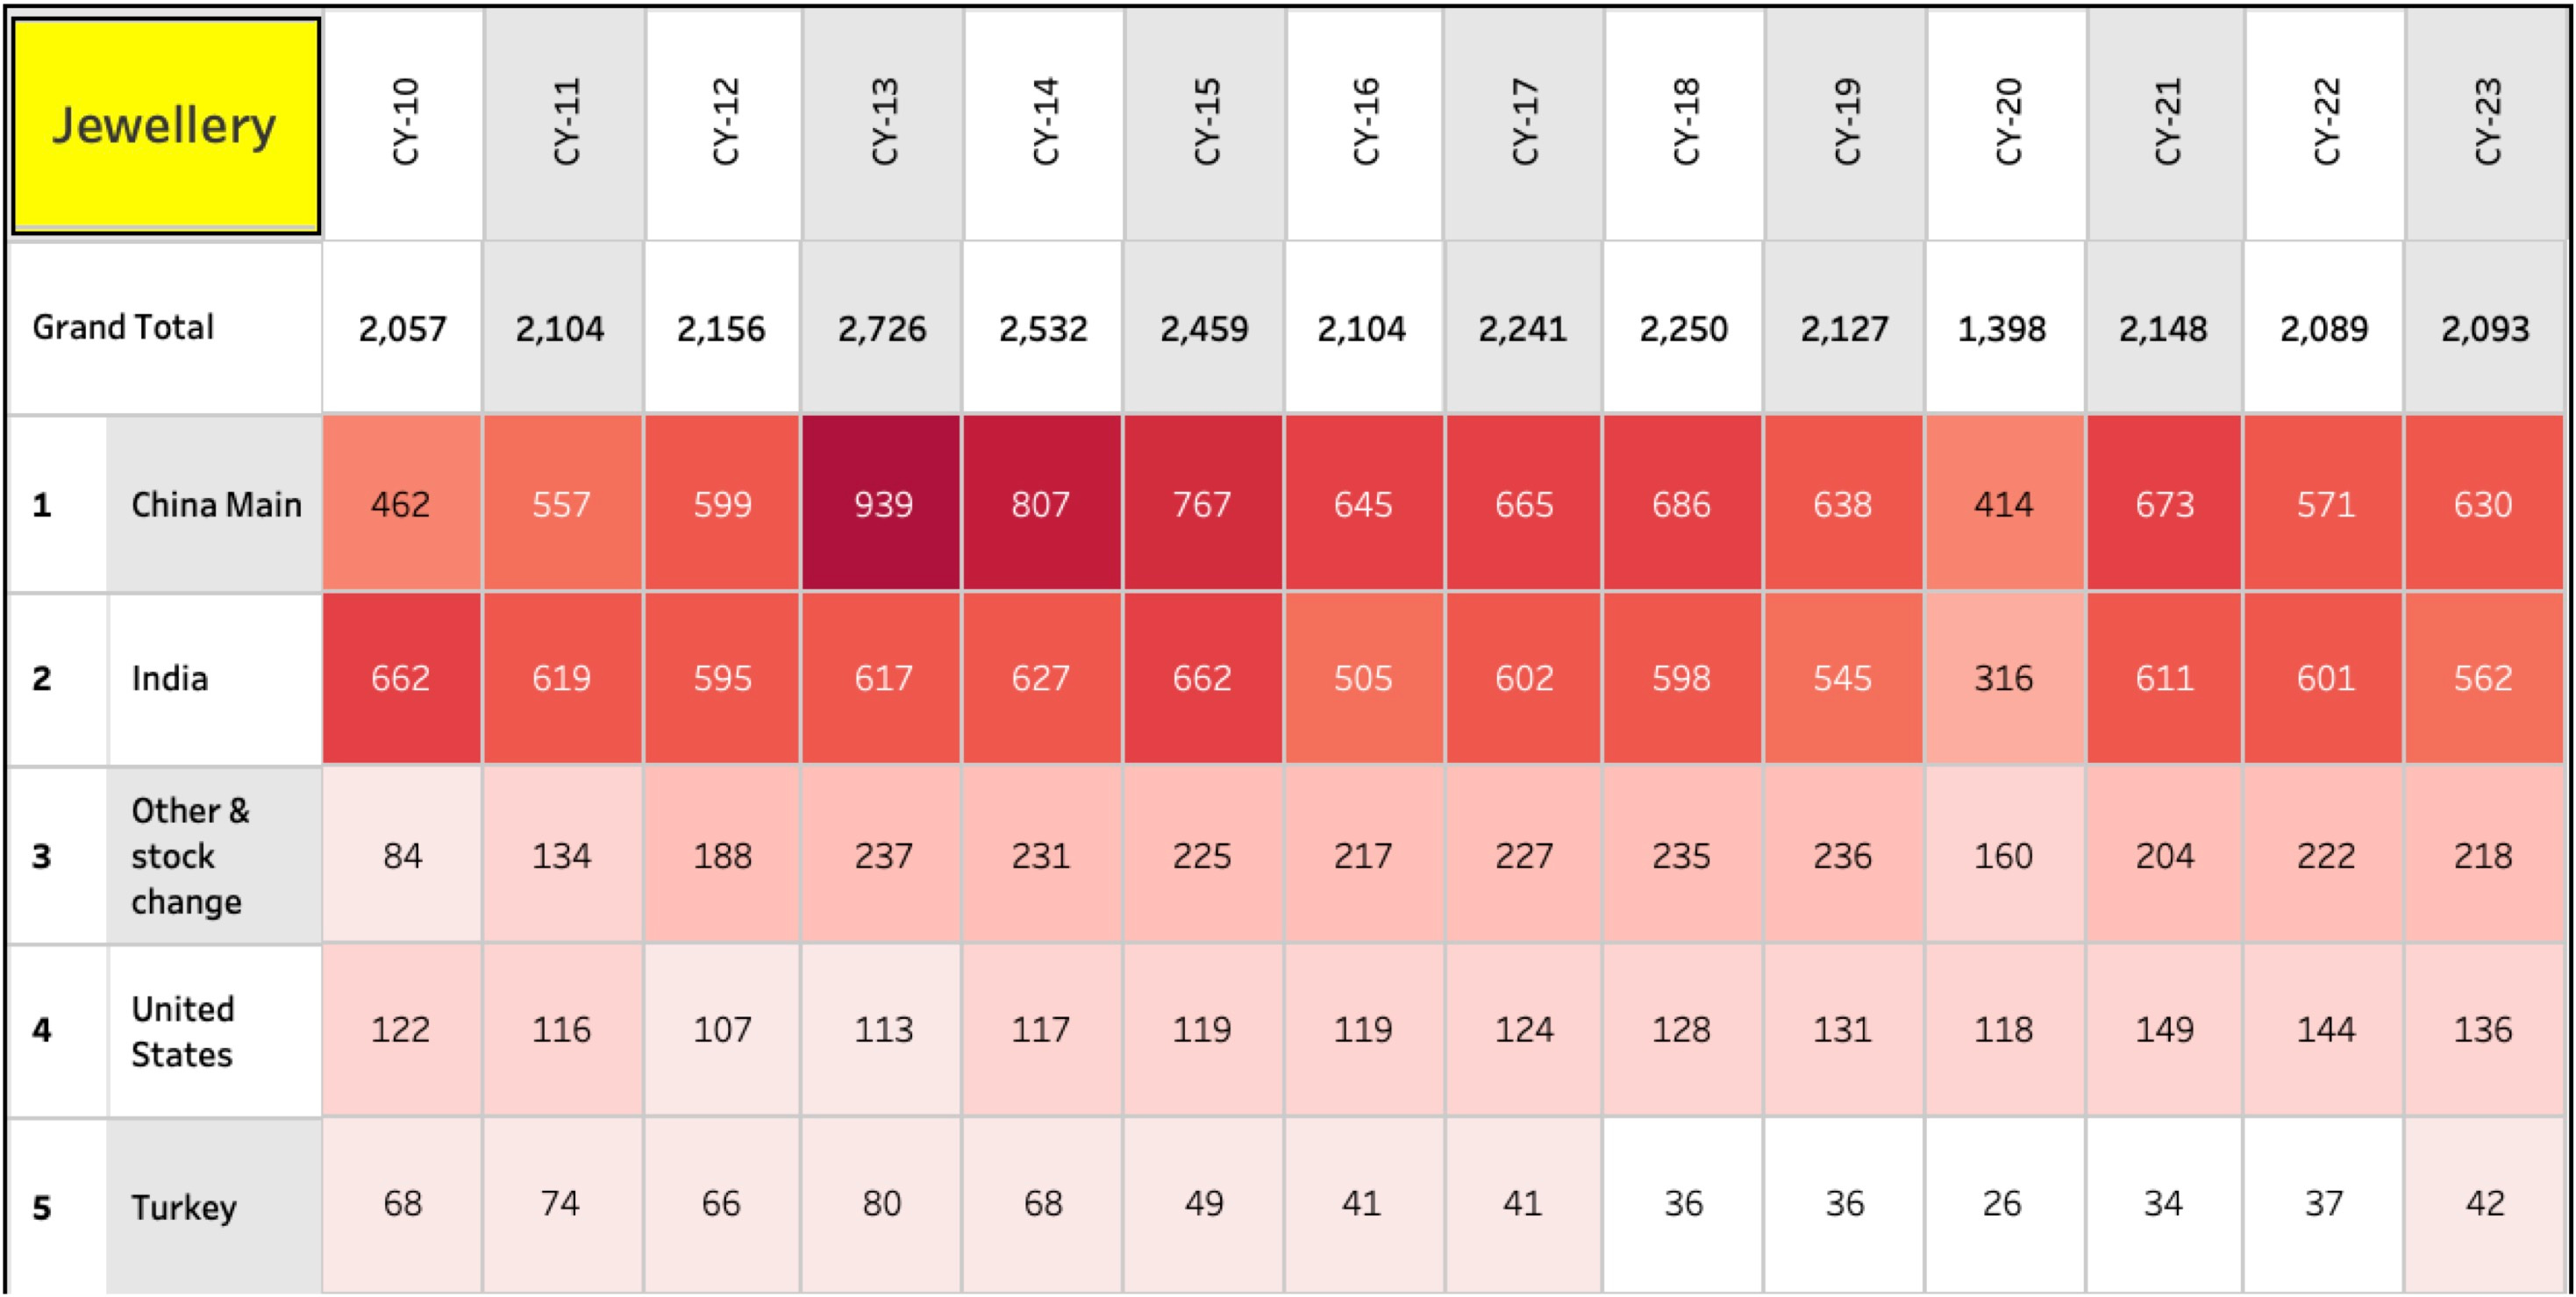


In these three segments, only India and China have consistently kept their demand steady on all the segments, with relatively stable trends and few exceptions - keeping the aggregate demand at a stable level. This stability indicates that the global rise in gold prices cannot be solely attributed to increasing consumer demand in these key countries, outside of central bank activities.
Key Country-Wise Demand (Central Banks)
The chart below highlights the yearly demand of central banks from countries with the largest gold reserves, spanning from calendar year 2005 (CY-05) to 2024 (CY-24). Not all central banks have been active in the gold market since CY-05. In fact, the central banks of economies holding the most gold, such as the USA, Germany, Italy, and France, have decreased their gold quotas.
Conversely, the central banks of Russia, China, India, and Turkey have been increasing their holdings. The Russian Central Bank, starting in CY-06, has amassed up to 1,943 metric tons (MT) of gold, making up the majority of its total holdings of 2,330 MT by CY-19. China began purchasing gold in CY-09, and while its trading has been intermittent, the quantities have been substantial, with a notable increase in CY-23. India has consistently increased its purchases since CY-18. Turkey's gold trading has fluctuated, with significant sales in CY-23 and purchases in CY-24.

Gold as a Shifting Strategy from US Treasury for Central Banks?
The next crucial question to address is whether the increased focus on gold represents a strategic shift by the central banks of the leading gold-holding economies. To explore this possibility, we need to analyze the data on holdings of U.S. securities by foreign residents, encompassing both long-term and short-term securities. This data is detailed in the table below.

It is evident that China has significantly reduced its holdings in U.S. securities, offsetting this by increasing its gold reserves. Since calendar year 2014 (CY-14), China has decreased its holdings in U.S. Treasury securities by 40%. Concurrently, the Chinese Central Bank has boosted its gold reserves by 1,203 metric tons (MT), which now constitutes 53% of its total gold holdings. In contrast, the Indian Central Bank has pursued a dual strategy. It has continued to accumulate gold while also maintaining its holdings in U.S. Treasuries.
Why is the Chinese Central Bank Increasing its Gold Reserves?
The strategic behavior of the Chinese Central Bank may find a parallel in the actions previously taken by Russia's Central Bank. Historical data reveals that Russia began reducing its U.S. Treasury reserves well in advance, opting to increase its gold holdings—likely in anticipation of deteriorating relations with the U.S. Given the recent escalation in tensions between China and the U.S., particularly concerning Taiwan, it is plausible that China is similarly bolstering its gold reserves as a precautionary measure. In contrast, the Indian Central Bank's strategy appears to be driven more by a desire to diversify its foreign exchange reserves rather than by geopolitical concerns. The accompanying chart below provides a visual comparison of these strategies.

Who is Buying All the Gold, and Where is This Extra Demand Coming From?
Most of the surge in gold demand is primarily from central banks in India and China, alongside other institutions. Interestingly, the international demand for jewelry has decreased globally, falling from 2,148 metric tons (MT) in CY-21 to 2,093 MT in CY-23. Conversely, demand for bars and coins has remained relatively stable, shifting slightly from 1,180 MT in CY-21 to 1,190 MT in CY-23.
Gold Demand is Increasingly Driven by Other Institutions, Surpassing Central Banks:-
Notably, the central bank demand, which was significant in CY-21 with 411 MT out of the total 450 MT, witnessed a shift in CY-22 and CY-23. During these years, much of the demand pivoted to other institutions; in CY-22, of the total 1,082 MT, only 416 MT was attributed to central banks, with the remainder purchased by other entities. This trend continued into CY-23, with central banks accounting for only 405 MT of the total 1,037 MT, indicating a significant contribution from other institutions.
The Chinese Central Bank is the Leading Buyer Among Central Banks:-
Analyzing the specific contributions by country, Chinese central banks and other institutions accounted for 55.5% of the total central bank trade of 405 MT in CY, while Indian central banks contributed merely 4%, equating to 33 MT in CY-22 and 16 MT in CY-23. Therefore, the primary driver of the rising demand for gold is predominantly the increased purchasing by Chinese central banks and other institutions, rather than significant buying by Indian central banks.
Why Have Other Institutions Dramatically Increased Gold Purchases in CY-22 and CY-23?
The substantial increase in gold purchases by various institutions in CY-22 and CY-23 can largely be attributed to the weakening of the U.S. dollar, which stems from persistently high inflation and decreased valuations of U.S. Treasury yields—fueled by expectations of continued high inflation. The chart below provides a bird’s eye view of these economic indicators.

The first segment of the chart illustrates the steady rise in CPI inflation in the U.S. The middle section displays the Federal Reserve's interest rates, which have been maintained at elevated levels to curb further inflation. The final segment shows the yields of U.S. Treasury bonds across various durations, from 6 months to 30 years. Notably, CY-22, CY-23, and CY-24 marked unprecedented highs across all three metrics: CPI inflation, Federal Reserve policy rates, and bond yields. Such a convergence of high rates across these indicators has not been observed since CY-2008.
As institutional investors foresee prolonged high inflation in the U.S., their confidence in U.S. Treasuries has plateaued since CY-21, evident from the declining trend in long and short-term U.S. Treasury purchases by foreign residents. This shift is clearly depicted in the accompanying chart, driving investor sentiment towards gold as a more secure investment like Gold.
Can Increased U.S. Debt Also Be a Factor Contributing to the Weakening of the U.S. Dollar?
Possibly yes, as evidenced by the accompanying chart. It highlights two significant spikes in U.S. debt: first following the 2008 financial crisis, and second after the COVID-19 pandemic. This surge in debt, fueled by extensive money printing, has significantly disrupted the U.S. bond market. Increased yields, driven by heightened inflation expectations, have been a major factor in the diminishing confidence in the U.S. dollar. Additionally, deteriorating relations between the U.S. and major global economic powers have compounded this issue, prompting investors to turn to gold as a safe haven. As of the end of CY-23, U.S. total debt stands at $33.2 trillion.

Summary
Gold Supply: The global supply of gold has remained largely steady, totaling 4,999 metric tons (MT) by the end of CY-23.
Demand Drivers: Gold demand is primarily driven by other institutions, rather than central banks, with significant exceptions in China and, to a lesser extent, India.
Russian Influence: The Russian Central Bank has not significantly influenced gold prices as it has not made substantial purchases in CY-22 and CY-23.
Other Central Banks: Apart from Turkey, which bought 148 MT in CY-22 and sold 2 MT in CY-23, major gold-holding central banks (other than China and India) have not been active buyers.
China's Strategy: The Chinese Central Bank is increasing its gold reserves to diversify its foreign exchange reserves while reducing its holdings in U.S. Treasuries.
India's Approach: The Indian Central Bank is also acquiring gold, primarily as a diversification strategy, without reducing its U.S. Treasury holdings.
Institutional Demand: Most gold demand stems from institutional investors, not central banks, reflecting a broader trend of diminishing confidence in the U.S. dollar.
Consumer Demand: There has been a slight decrease in consumer demand for gold.
Impact of U.S. Economic Policies: The institutional shift towards gold is largely driven by concerns over unprecedented inflation expectations in the U.S., following a significant increase in money supply post-COVID.
U.S. Debt Concerns: Increasing U.S. debt levels have further weakened the dollar and dampened investor confidence in U.S. Treasuries, enhancing gold’s appeal as a safe haven.
Future of Gold Demand
The future of gold demand is expected to be heavily influenced by Chinese central banks, which still need to divest their remaining $775 billion investment in U.S. Treasuries. Considering the current price of $2400/oz, 1 metric ton (MT) of gold costs approximately $77 million USD. With the Chinese Central Bank having purchased 287 MT in CY22 and CY23, an additional 287 MT would cost around $22 billion—a mere fraction of their total U.S. Treasury holdings. Other institutional investors are likely to continue purchasing gold as long as uncertainties surrounding the U.S. dollar, such as inflation and debt levels, remain unresolved. Moreover, global conflicts, such as those in Ukraine and between Israel and Hamas, may sustain heightened demand for gold. The duration of these market conditions, however, remains uncertain and challenging to predict accurately.