

Assessing India's Economic Divide: Implications for Telecom and Mass Market Strategies
Assessing India's Economic Divide: Implications for Telecom and Mass Market Strategies
Per capita GDP figures reveal that a majority of Indians earn below the national average, posing significant challenges for telecom and mass market sectors relying on broad consumer spending

A few days ago, I explored how the monthly expenditure patterns of Indians in both rural and urban segments might reflect the potential for Indian telecom operators to sustain tariff hikes. This analysis, based on recent NSSO data, provided a broad view of Indian spending across various product and service categories. Today, I plan to delve deeper into this topic using the same report, along with additional references, to estimate the income levels across various telecom circles. This will cover both rural and urban segments, across different population and income classes.
The aim is to examine claims by telecom operators that despite increases in per capita GDP—a proxy for individual income—over recent years, these have not translated into higher tariffs, suggesting significant room for price adjustments in mobile tariffs due to this increased income. The insights from this analysis will not only be relevant to the mobile industry but could also help gauge potential demand across various other industry segments and products. Let's dive deep into this analysis to uncover the underlying economic dynamics.
Step 1 - Estimating Per Capita GDP by Telecom Circle
While seeking detailed RBI data series that captures per capita GDP segmented by Indian states up to the latest year, I encountered a gap—no direct data for all states was available. To address this, I utilized a close proxy: the RBI's data on Per Capita Net State Domestic Product, which is broken down by states and aggregates to the Pan-India number for the base year of 2011-12 through the financial year 2022-23. However, this data set is not comprehensive for all states.
To navigate this limitation, I computed state averages for the years where data was available, which allowed me to determine the ratios of State GDP to the national averages. By assuming these ratios remain relatively stable, I was able to extrapolate the state-wise per capita GDP for all Indian states using the latest national Per Capita GDP figures, which are readily available. The table below presents these extrapolated GDP numbers, categorized by telecom circles, providing a foundational metric for further analysis.

Step 2 - Estimating Per Capita Rural & Urban GDP by Telecom Circle
Having determined the circle-wise per capita GDP, the next challenge is to segment these figures into rural and urban components. This differentiation is crucial because rural and urban markets exhibit distinct characteristics and are therefore approached differently by telecom companies in terms of business and customer acquisition strategies.
To achieve this, I first sourced population numbers for each Licensed Service Area (LSA), broken down by urban and rural segments, from Wikipedia. I then utilized the Monthly Per Capita Consumption Expenditure (MPCE) data from the NSSO report, which categorizes expenditure for both rural and urban segments. This approach differs from the one used in my previous article, where I relied on estimated household numbers provided in the report - both approaches are approximately identical.
By calculating a blended MPCE figure and assuming a direct correlation between per capita GDP and MPCE values, we can extrapolate the rural and urban per capita GDP. This is done by using the ratios of segmented MPCE to the blended value. The extrapolated rural and urban per capita GDP figures are presented in Columns 12 and 13 of the table below.

Step 3 - Segmenting Per Capita GDP Across Income Groups
This step involves further refining our analysis by distributing the estimated rural and urban GDP figures across different income segments within the population. This segmentation allows us to understand how GDP per capita varies across various economic strata.
Utilizing NSSO Data for Income Segmentation
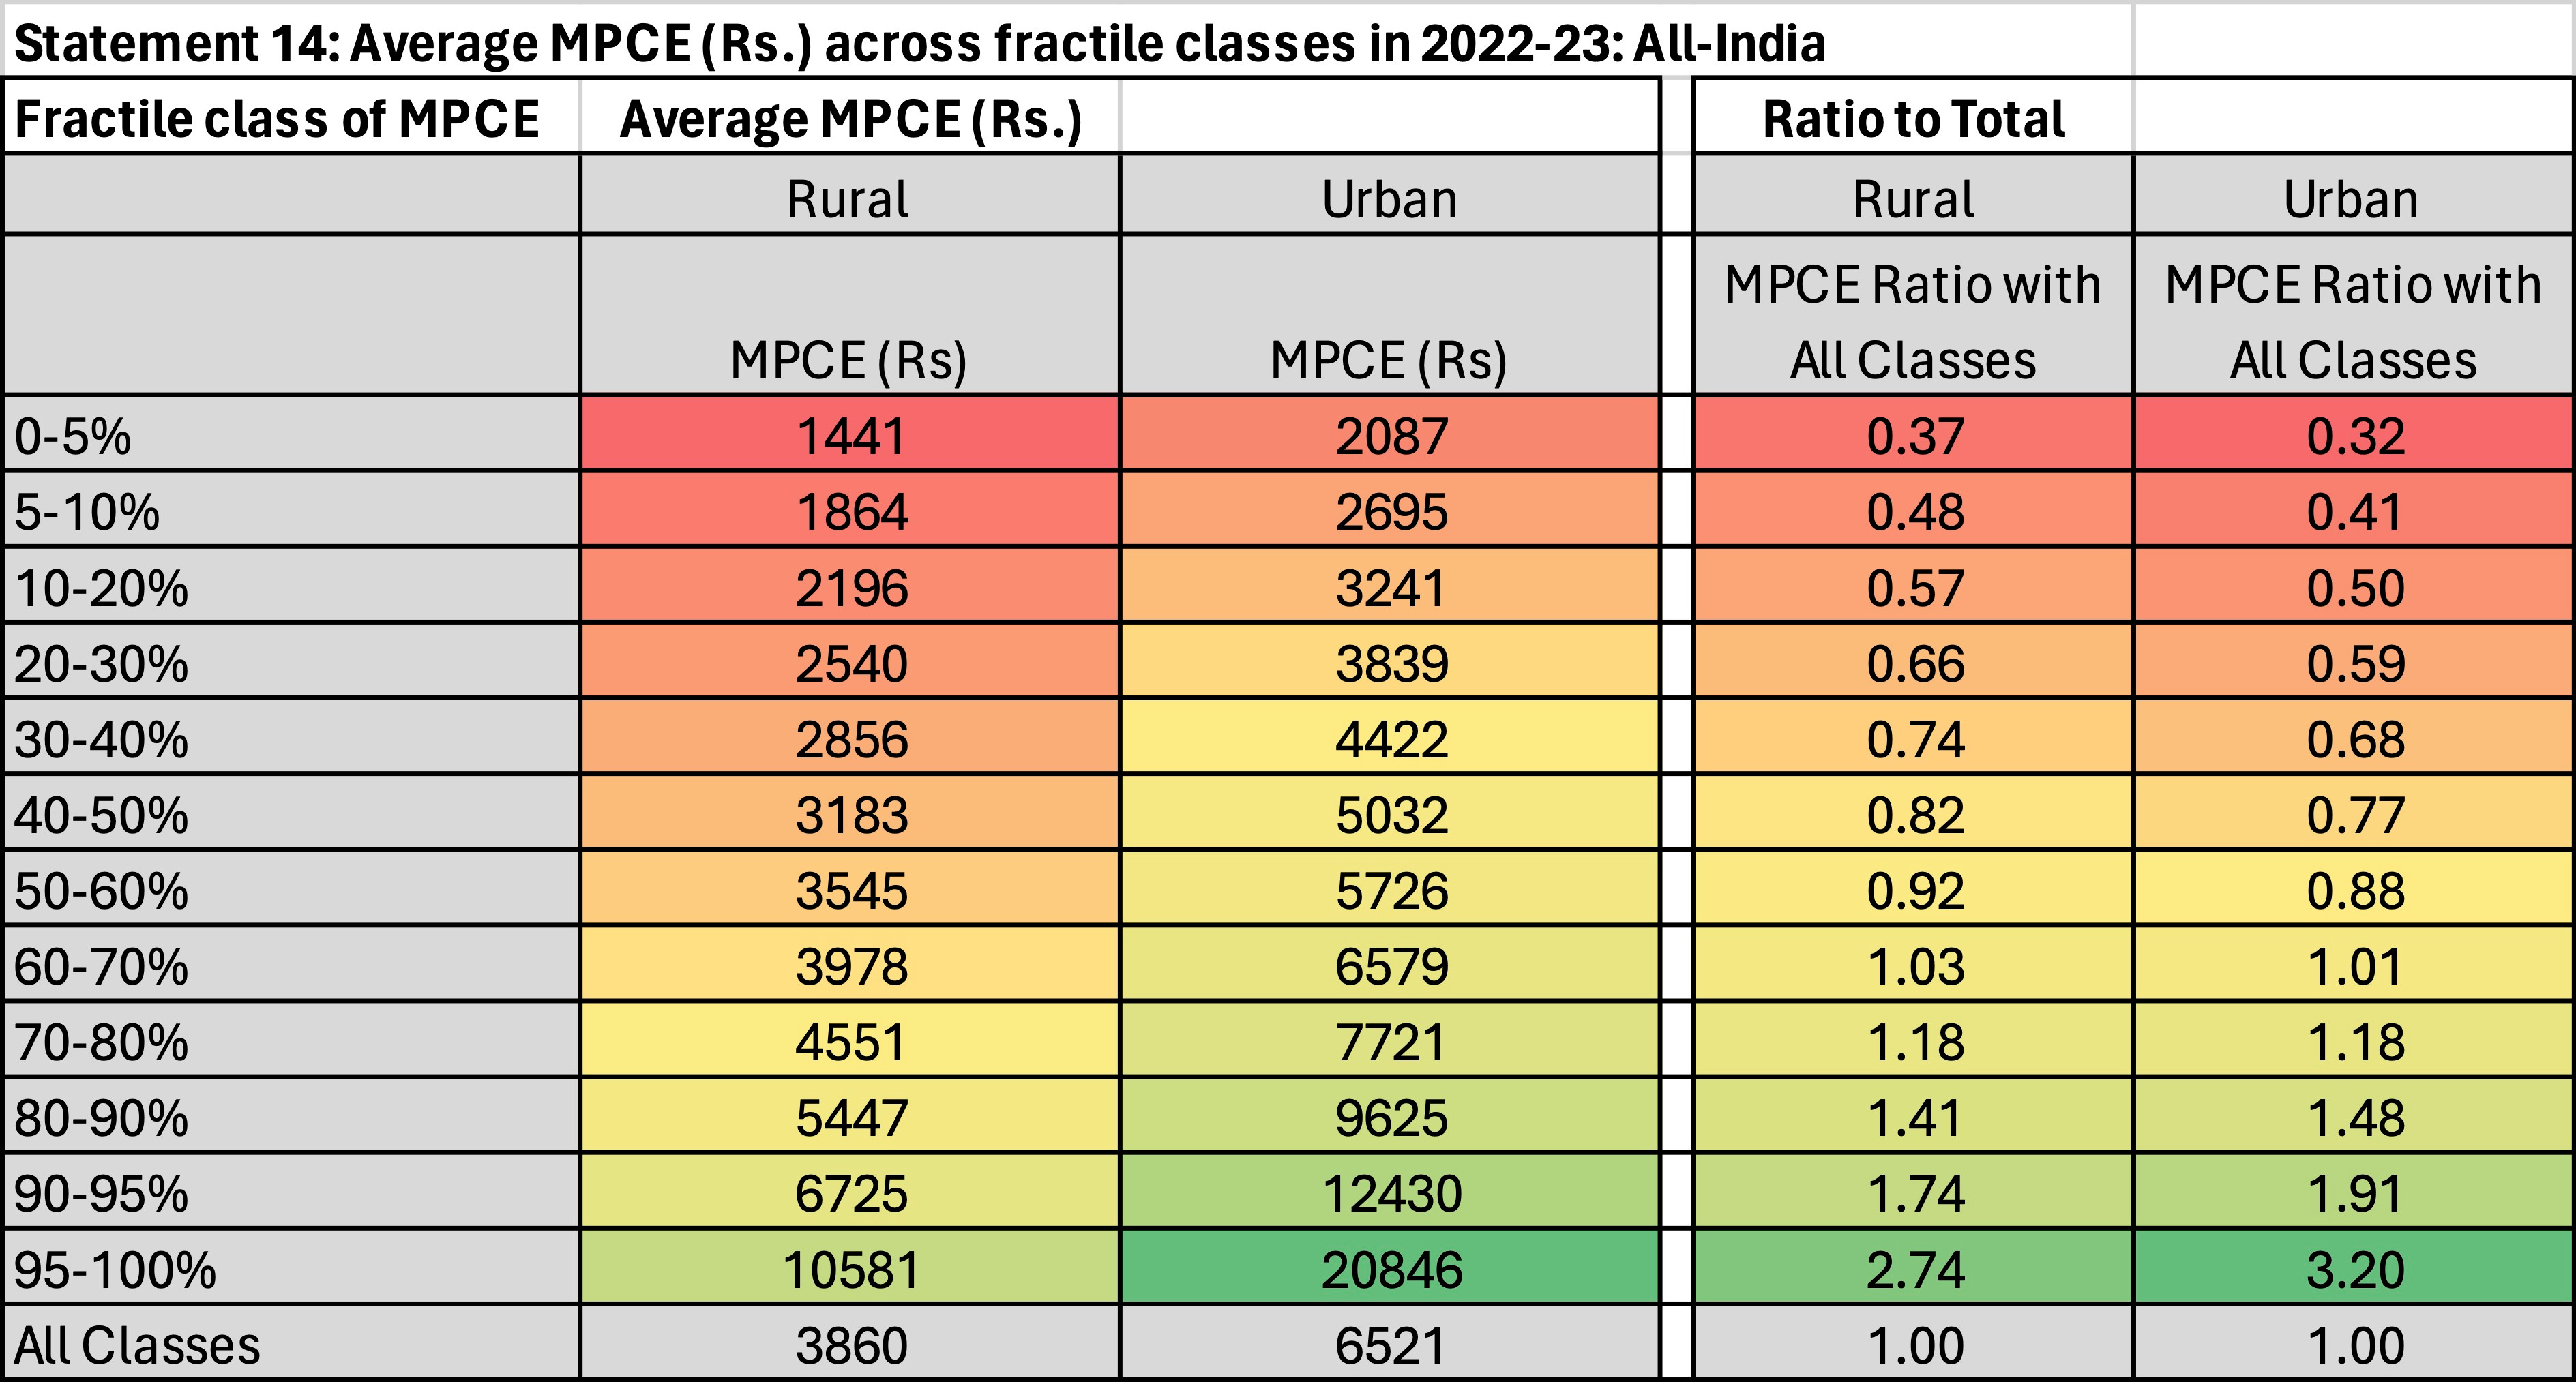
To achieve this segmentation, we leverage Statement 14 from the NSSO report, which provides a pan-India distribution of Monthly Per Capita Consumption Expenditure (MPCE) among various fractile classes. The distribution from this statement serves as a base to break down the GDP numbers.
Rural - GDP Distribution by Income Fractiles
The table below uses the rural MPCE ratios from the NSSO report mapped to various fractile classes. By applying these ratios to the extrapolated rural GDP figures from each circle, we can estimate the GDP per capita for different income segments within the rural population. This method ensures that our GDP distribution aligns with the consumption patterns observed in the survey data.

Urban - GDP Distribution by Income Fractiles
For the urban segments, we adopt a similar approach. The urban MPCE ratios are applied to the circle-based GDP numbers to calculate per capita GDP distribution among various fractile classes. This segmentation reflects the economic diversity within urban areas and provides a granular view of income distribution.

Both sections include tables that show the calculated GDP per capita for each fractile class, providing a clear, visual representation of how GDP is distributed among different income groups in rural and urban areas. These tables are critical for stakeholders to understand the economic capabilities and challenges within each segment.
Step 4 - Extrapolating Population Numbers Within Income Fractiles
To deepen our analysis, we next extrapolate the population numbers for each income fractile using the demographic data available for both urban and rural segments. This step is crucial for understanding the population distribution across different economic tiers within each telecom circle.
Utilizing NSSO Report Data for Demographic Distribution
By employing data from Statement 14 of the NSSO report, which details population distributions by fractile class, we can extend this information to the circle-based population data we've gathered. This extrapolation allows us to accurately assign population numbers to each fractile class, providing a foundational layer for our final analysis. Although the method and resultant data are straightforward and involve standard extrapolation techniques, they are essential for ensuring the accuracy of our economic assessments and strategies.
This step, while methodical, does not require the detailed reproduction of tables here as the process is relatively straightforward and the extrapolation does not provide additional insights beyond the methodology described. This keeps our focus on impactful data and interpretations in our final analysis.
Step 5 - Analyzing Population vs. Income Distribution and Vice Versa
This step delves into the correlation between population distribution and income levels, utilizing per capita GDP as a proxy for income across urban and rural segments.
Urban Segments
Insights into Income Distribution:
The chart below offers a detailed view of the income distribution among the urban population in India. Notably, 51% of India’s urban dwellers earn below the national monthly average income of Rs 25 K. This segment includes a significant proportion of the population from various states, with 95% in Bihar and Uttar Pradesh East, 80% in Jammu & Kashmir, Assam, Madhya Pradesh, Rajasthan, North East, and Odisha, and progressively lower percentages in other states. The top part of the dashboard provides a panoramic view of how income is distributed across different fractile classes, highlighting states with lower average incomes positioned towards the left of the chart.

Rural Segments
Comparative Rural Insights:
Similarly, the rural segment exhibits trends that mirror those in urban areas, albeit with generally lower per capita GDP figures (Pan India Rs 18K). The strain on rural incomes is evident from the chart's top segment (see below), where subdued income stretches across the full spectrum of the circle. This contrast is more pronounced than in urban areas, highlighting the broader economic challenges faced by rural populations.

Conclusion: Insights and Implications for Telecom and Broader Markets
From our analysis, it is clear that per capita GDP figures, often used to gauge market size and business growth potential for telecom companies, can be misleading. Despite operating across diverse geographies, these companies primarily serve customers whose income levels are significantly below the national average. For instance, in urban areas, 151.3 million people contribute to a meager per capita GDP of Rs 18,000 per month, a figure that dramatically increases to 660 million people in rural areas.
This analysis reveals that about 60% of India's population earns a per capita GDP of Rs 18,000 ($216) per month. When this threshold is doubled, approximately 87% of the population (305 million urban and 894.4 million rural) earn Rs 36,000 ($432) or less per month. Consequently, only 13% of Indians (6% rural and 29% urban) contribute to a higher per capita GDP of Rs 36,000 per month and above.
Given these dynamics, sustaining tariff hikes across all circles will be challenging. For instance, 40% of Reliance Jio's subscribers are from just 7 circles with the lowest per capita GDP figures. Similarly, for Bharti Airtel, this figure is 38%, and for Vodafone Idea, it's slightly lower at 35%.
This comprehensive analysis extends beyond the telecom sector, shedding light on the viability of businesses targeting low-end and mass market products. Until there is a substantial increase in India's per capita GDP, the market will continue to be dominated by low-quality, inexpensive products, presenting significant challenges for companies looking to invest in these segments due to slim profit margins.
Thank you for engaging with this analysis. I hope it provides valuable insights into the economic factors shaping market dynamics and business strategies in India.